
Live request log
The Live section lists every request that reaches the project's server, as it happens, with the response it got. Use it to see what your app really calls, and why a call did not get the reply you expected.
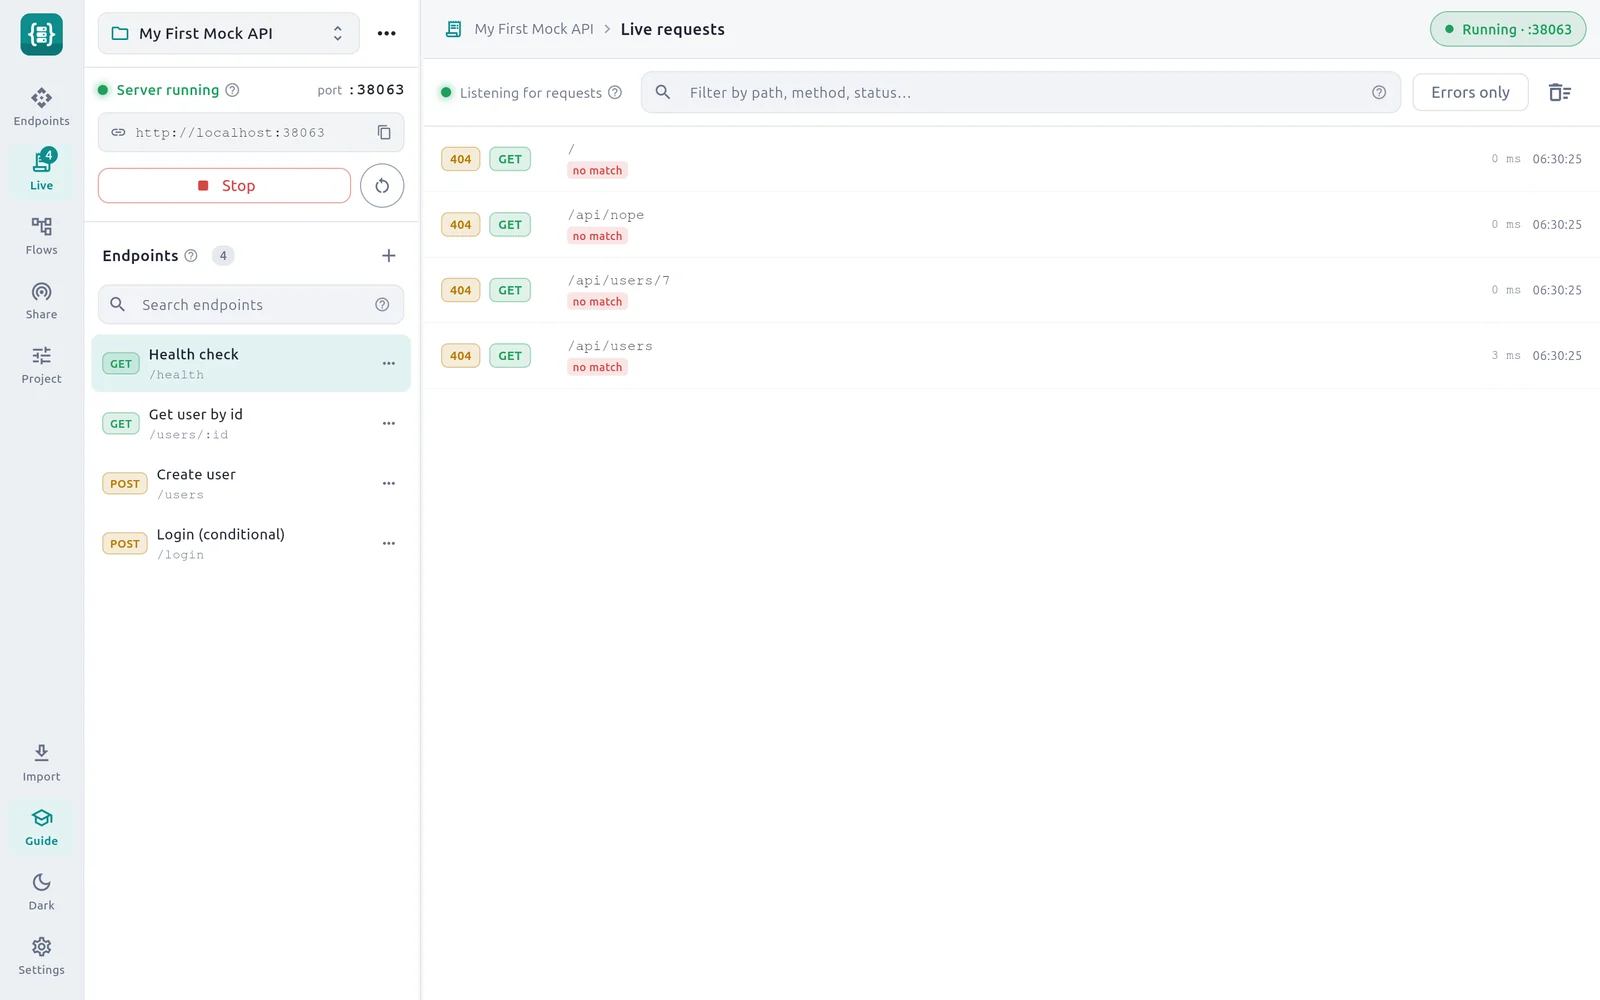
- 1Live — The badge counts the requests in the log.
- 2Listening for requests — The server is running. It reads Server stopped otherwise.
- 3Filter — Shows only requests containing your text.
- 4Errors only — Shows only responses with status 400 or higher.
- 5Clear — Clears all logged requests.
- 6Status and method — The status code sent back and the request method.
- 7Tag — no match, proxied, or the endpoint and response that answered.
- 8Duration and time — How long the reply took and when the request arrived.
Open the log
Select Live in the rail. The newest request is at the top. The list updates by itself while requests arrive, and keeps its place if you have scrolled down.
Requests are logged only while the server is running. The header reads Listening for requests or Server stopped.
Read a row
Each row shows, from left to right:
| Part | Meaning |
|---|---|
| Status | The status code sent back. RST means the connection was dropped by a fault, with no status. |
| Method | GET, POST and so on. |
| Path | The address the client asked for, with its query string. |
| Tag | What handled the request. See the table below. |
| Duration | Time from receiving the request to sending the reply, in ms, including any delay you set. |
| Time | When the request arrived. |
The tag under the path is one of:
| Tag | Meaning |
|---|---|
| Endpoint name · response label | An endpoint answered. The label is the response it sent, such as Get user by id · User found. |
| no match | No enabled endpoint fits this method and path, so the mock answered 404. |
| proxied | No endpoint matched, so the request was forwarded to the proxy base URL and the real reply was passed back. |
For some requests the server adds a note in place of a response label. You see it in the tag of a matched endpoint and in the Response field of the details:
| Note | Meaning |
|---|---|
CORS preflight | The server answered an OPTIONS request itself. |
Auth required | The endpoint requires an auth header and the request had none, so it got 401. |
Fault: connection reset | The response had the Drop connection fault. |
Fault: empty | The response had the Empty response fault. |
Fault: malformed | The response had the Malformed body fault. |
Proxy failed | The real API could not be reached, so the mock answered 502. |
Inspect one request
Select a row to open its details. Select the close button, or another row, when you are done.
| Field | What it shows |
|---|---|
| Time | When the request arrived, to the millisecond. |
| Duration | How long the mock took to answer. |
| Matched endpoint | The endpoint whose method and path fit the request. |
| Response | The label of the response sent, or a server note. |
| Request headers | Every header the client sent, one per line. |
| Request body | The data the client sent. |
| Response headers | The headers sent back, including CORS and global headers. |
| Response body | The body sent back, with placeholders already filled in. |
The details are the best place to debug templating and rules. Request body shows exactly what the client sent, and Response body shows what each placeholder turned into.
Filter the list
- Type in Filter by path, method, status… to show only matching requests. The text is compared with the path, the query string, the method, the status code and the matched endpoint's name. Upper and lower case do not matter. Examples:
404,post,/users. - Select Errors only to show only responses with status
400or higher. - Select the clear button at the right to empty the log.
What is kept, and for how long
- The log holds the latest 500 requests per project. Older ones drop off the end.
- Bodies longer than about 64,000 characters are cut short in the log. The client still receives the full body.
- The log lives in memory. It is cleared when you quit Mock Studio and is never written to disk.
Good to know
The log shows whatever clients send, including Authorization headers and request bodies. Keep that in mind when you share your screen or a screenshot.
Find out why a call failed
The row says no match. The method or the path does not fit any enabled endpoint. Compare the path in the row with your endpoint letter by letter: /user is not /users, and paths are case-sensitive. Check the method too, and that the endpoint is enabled. See Endpoints and paths.
The wrong response was sent. Read the response label in the tag. With Conditional rules, open the details and compare the request's query, headers and body with your conditions. See Conditional rules.
A placeholder appears as typed, braces and all. The request had no value for it. Check the request in the details. See Dynamic templating.
Nothing appears at all. The request never reached this server. Check that the server is running, and that the client uses the right address and port. For another device, see Share on LAN or the internet.